Why the Scale Lies: Track Body Composition, Not a Number
I weighed myself two mornings in a row last month and the number went up 2.4 pounds.
Nothing had happened in between. I still spent an embarrassing chunk of that morning trying to find the meal that explained it. There was no meal.
Here is the answer up front: the scale isn’t inaccurate — it’s answering a different question than the one you’re asking. It measures total mass, honestly and precisely. You are asking about fat, and over any short window those two barely overlap. The fix isn’t to throw the scale away. It’s to read it differently and add one measurement.
I’m not a physician or a registered dietitian, and this is general information rather than medical advice. There is also a section below on body image and eating disorders that sits before the practical advice on purpose — please read it first.
What the scale actually measured this morning
One study answers this, and it didn’t estimate anything. It measured.
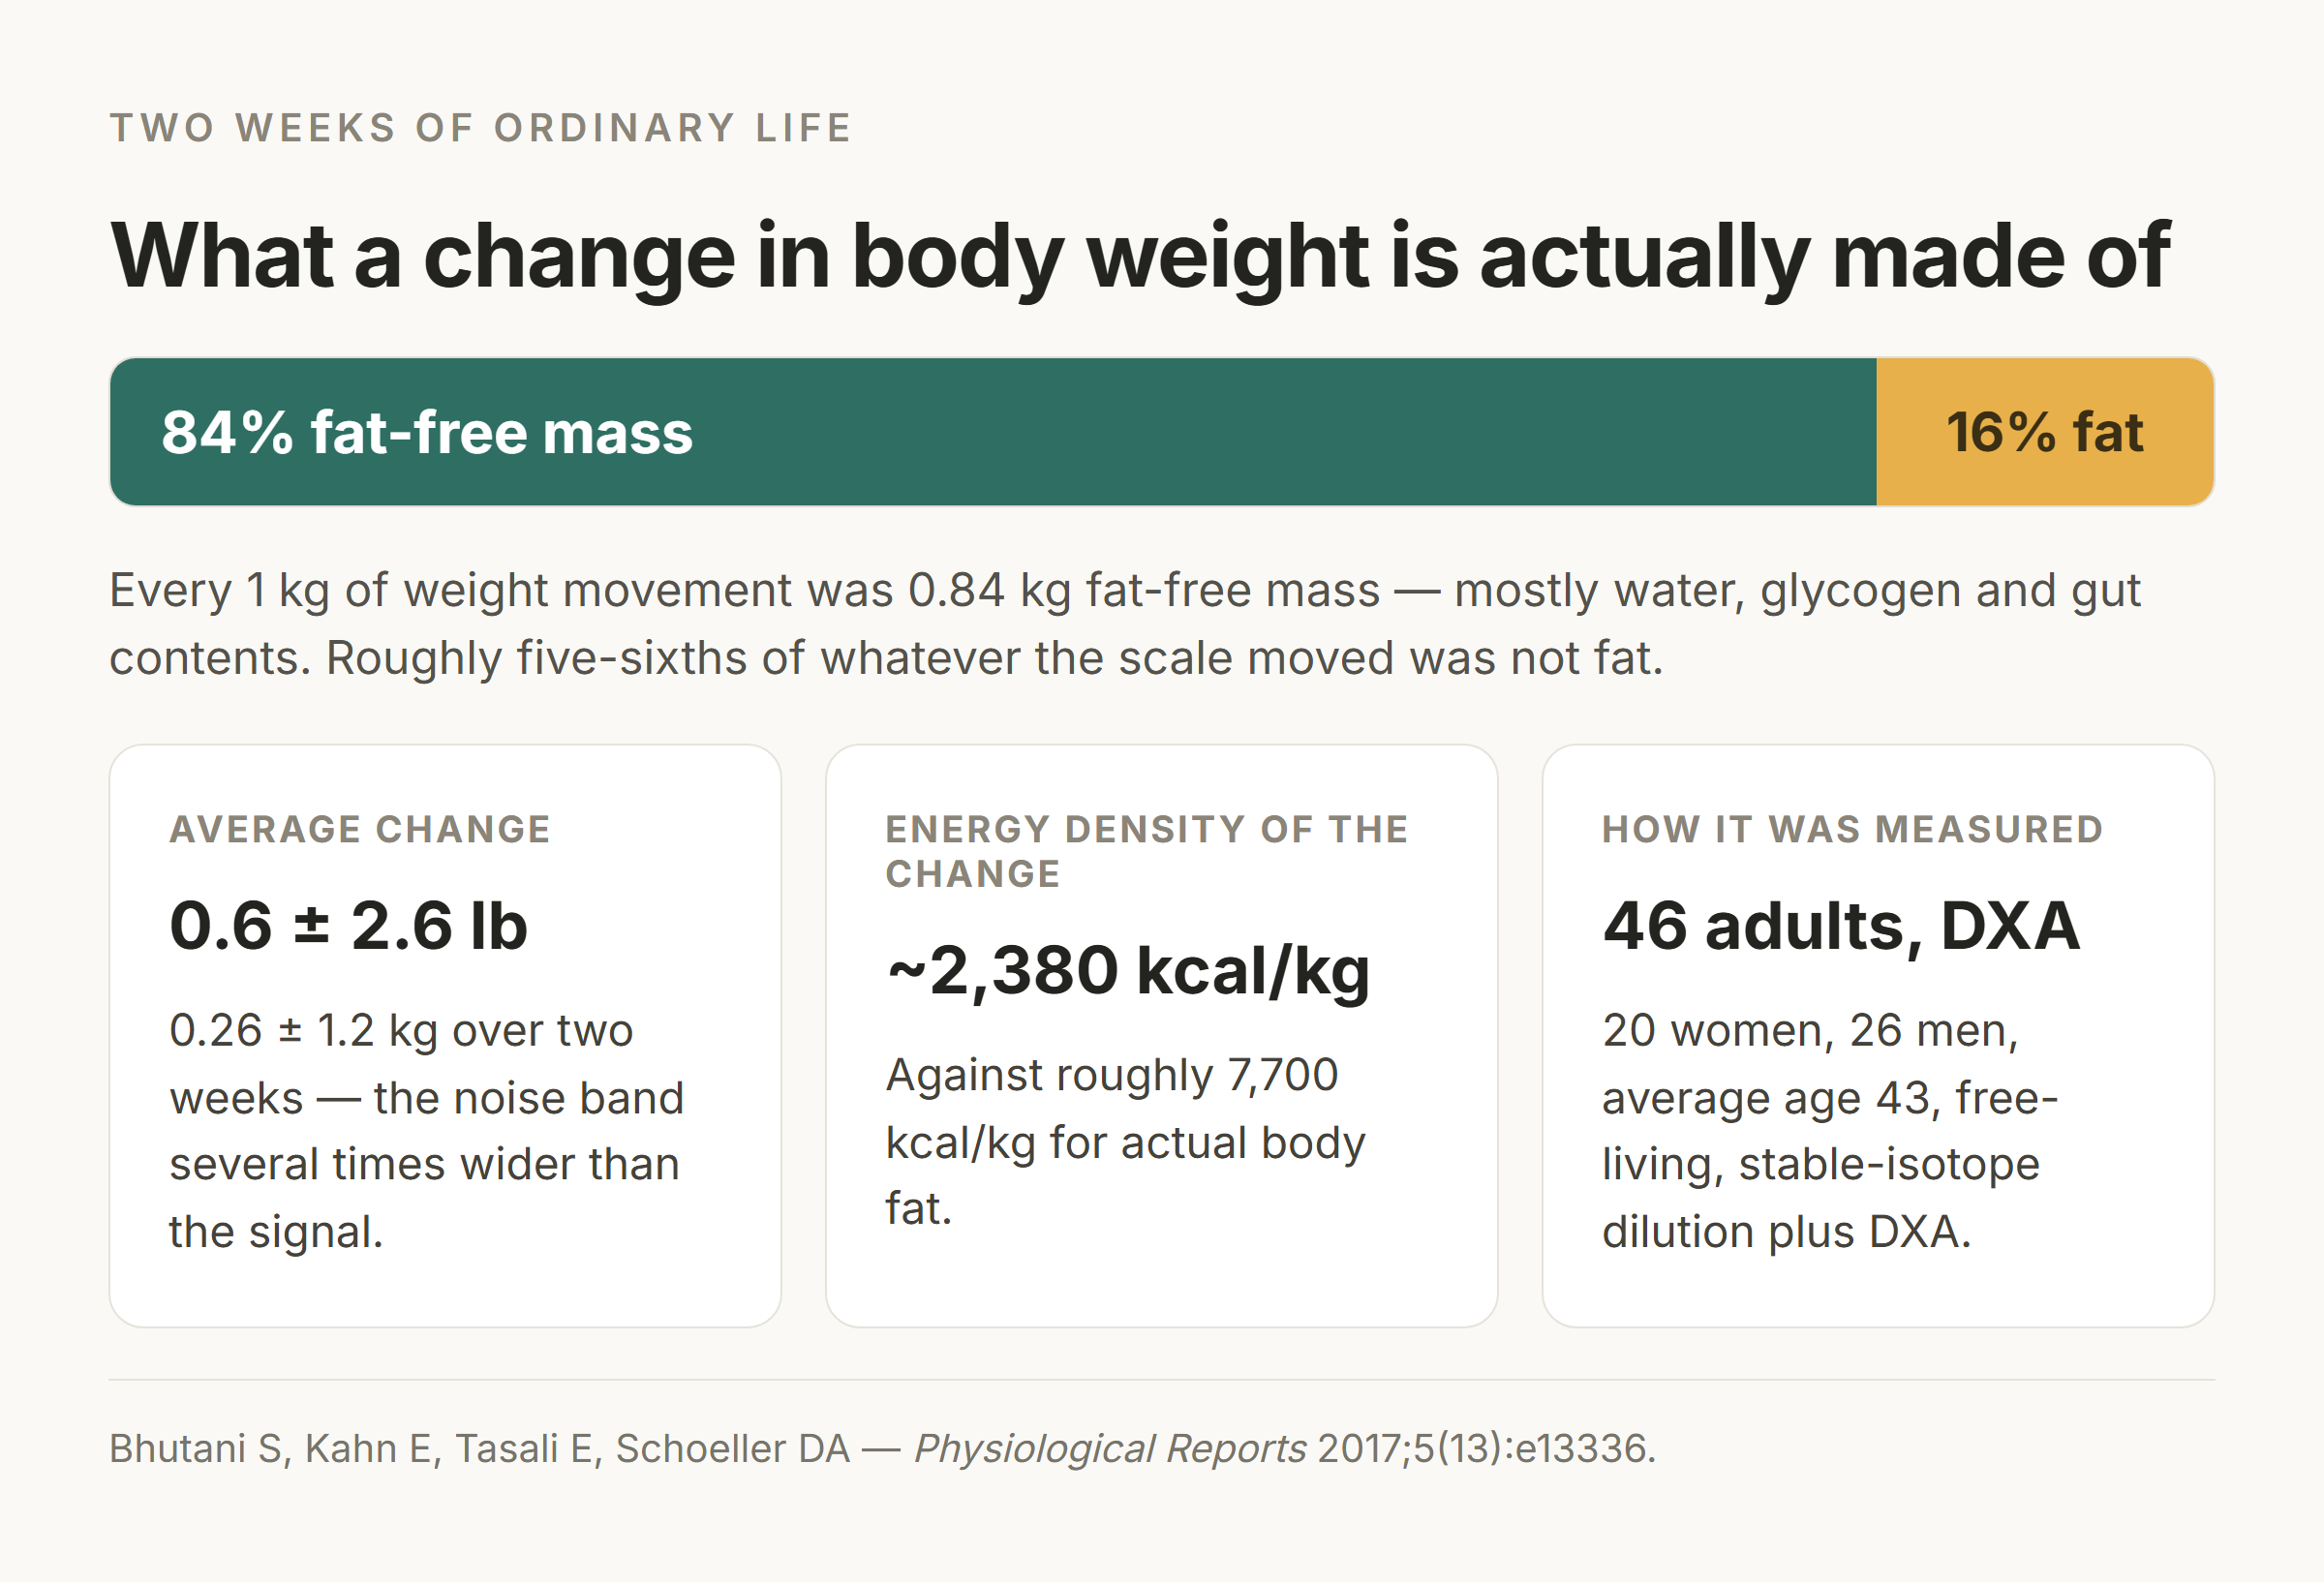
Researchers followed 46 free-living US adults — 20 women, 26 men, average age 43 — for two weeks of ordinary life, using stable-isotope dilution and DXA scans so fat and fat-free mass could be separated rather than guessed at.
Average weight change over the two weeks was 0.6 ± 2.6 lb (0.26 ± 1.2 kg). Read the second number: the noise band was several times wider than the signal.
And the composition of that change: every 1 kg of weight movement was 0.84 kg — 84% — fat-free mass. Only 16% was fat (Bhutani 2017).
Roughly five-sixths of whatever your scale moved was not fat. The energy density of that change — about 2,380 kcal per kg, against roughly 7,700 for actual body fat — confirms it.
So what is the other 84%?
Mostly water, moving around on its own schedule.
- Total body water can fluctuate up to ±5% in a day (Bhutani 2017). For a 170 lb (77 kg) adult that works out to roughly ±4.6 lb (±2.1 kg) — my arithmetic, and a physiological ceiling rather than a typical Tuesday.
- Glycogen is stored wet. “Each gram of glycogen is stored in human muscle with 3 grams of water,” as the paper puts it; an older review put it at three to four parts (Kreitzman 1992).
- Gut and fecal contents contribute 100–300 mL a day of variability on their own (Bhutani 2017).
One caution, because this is where most articles overreach. You have probably read that “the average person fluctuates 2 to 4 pounds a day.” I went looking for the source and there isn’t one — no study I could find reports a measured population mean for daily fluctuation.
What holds up is subtler. Weigh under standardized conditions — same time, after the bathroom, before eating or drinking — and the day-to-day noise is small, on the order of a pound. Weigh casually, at different hours, after a salty dinner or a hard session, and the same body can read several pounds apart, because total body water alone has that much room to move.
Most of the swing that upsets people is a measurement-conditions problem, not a fat problem.

Photo: cottonbro studio / Pexels
There is also a weekly rhythm, and it’s normal
Across 4,657 daily weight measurements in 80 adults, a repeating pattern showed up: weight is highest early in the week — Sunday and Monday — and declines through it. Increases begin Saturday; decreases begin Tuesday (Orsama 2014).
The authors’ own sentence is the one to keep: “Weight variations between weekends and weekdays should be considered as normal instead of signs of weight gain.”
Comparing Monday morning to last Friday is comparing two known points of a cycle. Compare the same weekday, or compare seven-day averages.
The muscle-versus-fat picture is much smaller than you were shown
You’ve seen the photo: a dense red brick of muscle next to a lumpy yellow blob three or four times its size, both labeled five pounds. I believed it for years. It’s wrong, and the real number is worth knowing precisely because it’s less dramatic.
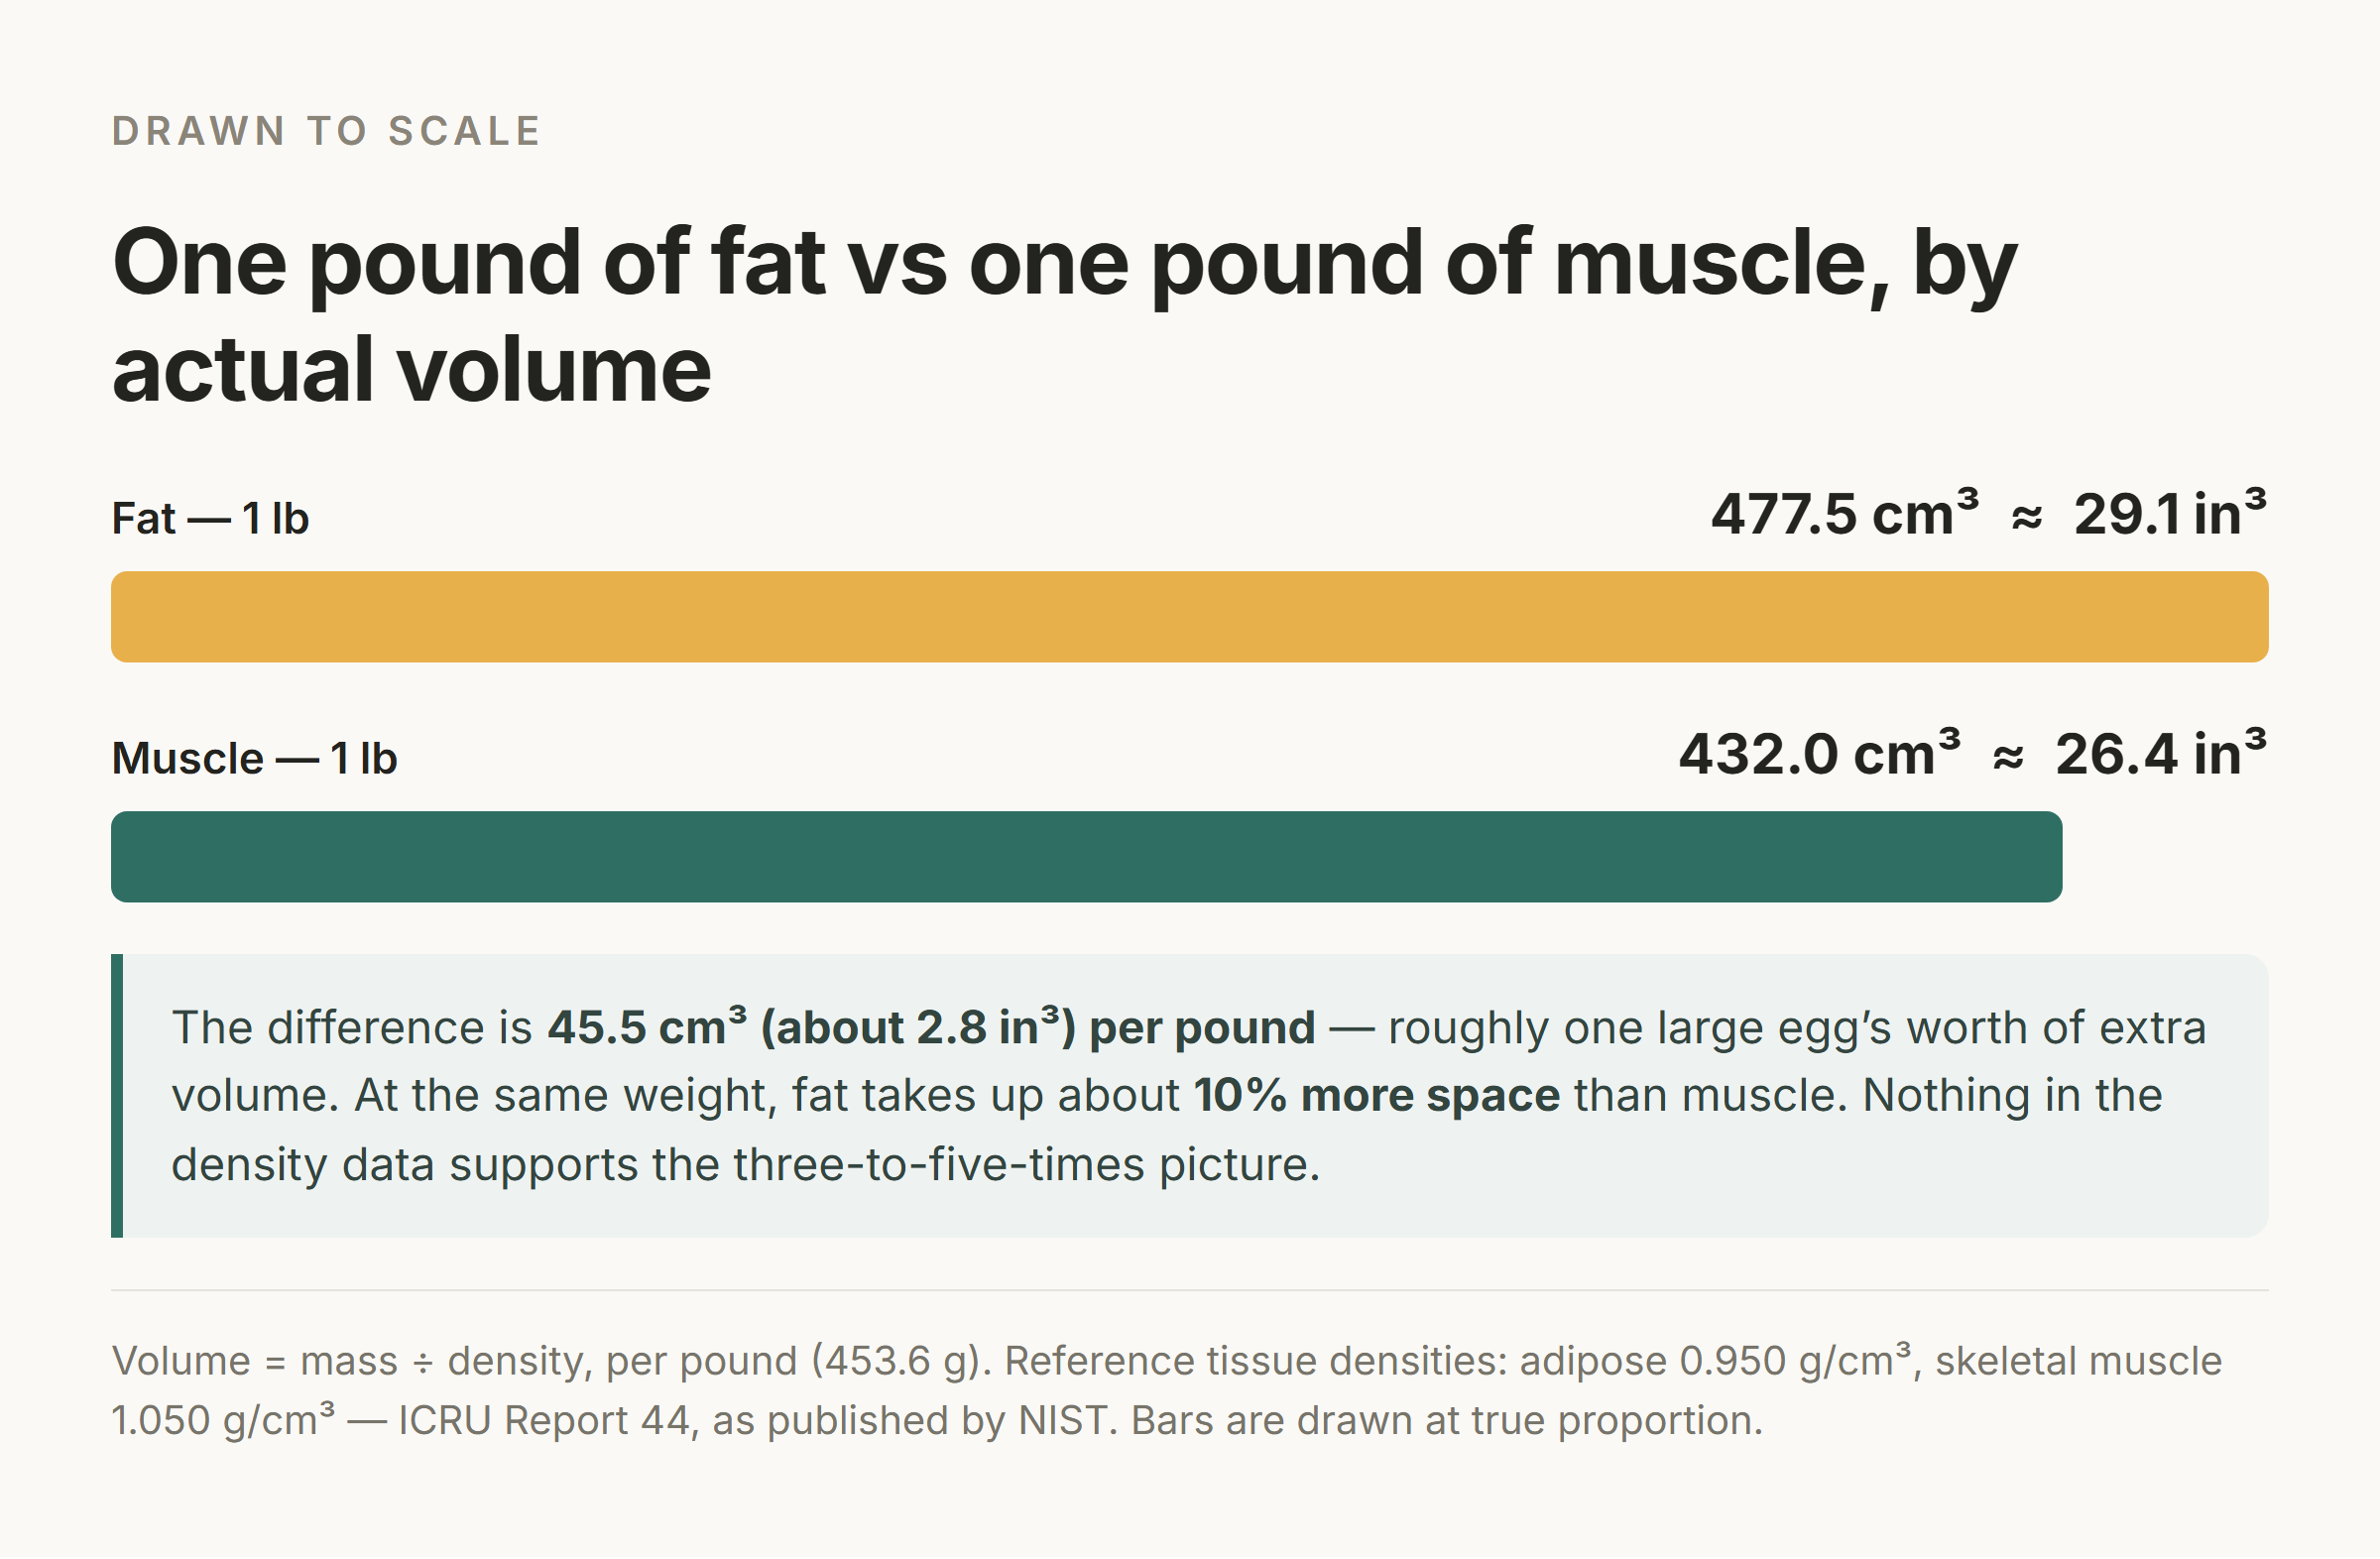
Reference tissue densities from ICRU Report 44, as published by NIST: adipose tissue 0.950 g/cm³, skeletal muscle 1.050 g/cm³. Volume is mass divided by density, so per pound (453.6 g):
- Fat: 453.6 ÷ 0.950 = 477.5 cm³ ≈ 29.1 in³
- Muscle: 453.6 ÷ 1.050 = 432.0 cm³ ≈ 26.4 in³
- Difference: 45.5 cm³ ≈ 2.8 in³ per pound
At the same weight, fat takes up about 10% more space than muscle. A pound of fat is roughly one large egg’s worth of extra volume — not multiples. Even the most generous version has a ceiling: compare muscle to pure lipid rather than to adipose tissue (which is roughly 15% water plus connective tissue) and the gap widens only to about 17%.
Nothing in the density data supports a three-to-five-times difference. Those images are marketing, not measurement.
Then why does a leaner body look different at the same weight?
Because density was never the main reason. It’s third on the list.
- Where the fat sits. Visceral versus subcutaneous distribution is what a waist measurement captures, and what carries the cardiometabolic risk. It’s why the same 10 lb looks entirely different on two people.
- Muscle shape and cross-sectional area — not muscle density.
- Only then, the ~10% density difference.
Swap 17 lb of fat for 17 lb of muscle on a 170 lb frame — 30% body fat down to 20% — and total volume changes by about 0.8 L (roughly 47 in³). Visible around a waistline, but on the order of a large drink bottle. Most of what you’re seeing in those comparisons is redistribution.
Waist is the measurement worth adding
This is the part that actually replaces the scale-staring, and it costs about six dollars and thirty seconds a month.
NHLBI states the US thresholds plainly: “A waist circumference of more than 35 inches for women or more than 40 inches for men increases your risk.” The same NCEP ATP III values in metric are ≥102 cm (40″) for men and ≥88 cm (35″) for women.
The method matters as much as the number, so here it is in NHLBI’s own words:
“Stand and place a tape measure around your middle, just above your hipbones. Measure your waist just after you breathe out.”
Same tape, same landmark, same breath phase, every time.
Two honest caveats
Those figures are US thresholds, not universal ones. The 2009 international statement harmonizing metabolic syndrome declined to set one global waist number, holding that “national or regional cut points for waist circumference can be used” (Alberti 2009). Several countries have derived lower ones — Bangladesh at 90 cm (35.4 in) for men and 80 cm (31.5 in) for women; 80.3 cm (31.6 in) for women in Uganda.
A waist-to-height ratio under 0.5 is a widely studied boundary value — not an official US recommendation, and I’d rather not dress it up as one. But the evidence is consistent: in a type 2 diabetes cohort, WHtR ≥0.5 with abdominal obesity carried hazard ratios of 1.18 for stroke and 1.20 for mortality (Park 2026), and in a general adult population 24.4% of people with a normal BMI still had high-risk central adiposity at WHtR ≥0.5 (Valeva 2026). In plain terms: keep your waist under half your height. At 5′10″ (70 in / 178 cm), that’s 35 in (89 cm).
The 2025 Lancet Commission on Clinical Obesity put it bluntly: “Current BMI-based measures of obesity can both underestimate and overestimate adiposity and provide inadequate information about health at the individual level.” Its Statement 14 holds that assessment needs direct body fat measurement, or at least one waist-based criterion in addition to BMI, or two such criteria regardless of BMI — using validated methods with appropriate cut-offs.
One number was never going to be enough.
Photo: Ron Lach / Pexels
Before you buy a body-composition scale
If “track body composition instead” sends you shopping, one thing is worth knowing first. I’m not naming or recommending any device.
Across 15 bioelectrical impedance devices tested, precision error was 0.00–0.49% — they repeat themselves beautifully. But constant error against the criterion method ran from −3.5% to +11.7% (Br J Nutr 2023). Reproducible is not the same as correct. It’s a clock that runs twenty minutes fast: useless for telling the time, useful for timing how long something took.
The inputs are soft, too. After eating, BIA impedance dropped 4.4% and estimated fat mass fell 1.4–2.4% on average, with individual decreases reaching 10% — from a meal, not from losing fat — and unlike DXA, “BIA estimates largely did not recover” after a second overnight fast (Tinsley 2017). Those were research-grade devices; consumer models share the same technology and limitations, though no study isolates them, so I won’t assign them an error figure.
Use the direction of change over weeks. Ignore the absolute percentage. And don’t hunt for a target: I could find no US government or professional body that publishes diagnostic body-fat-percentage ranges. Treat any “ideal body fat chart” you see as a rough convention, not a standard.
Please read this before you take progress photos
I nearly wrote a cheerful paragraph recommending monthly mirror checks and progress photos. Then I read the literature.
Mirror inspection, measuring body parts, pinching, repeated weighing and photographing your own appearance are all items on validated eating-disorder screening questionnaires — including the Body Checking Questionnaire (Reas 2002), where checking scores correlated highly with other measures of negative body image and disordered eating. A 2025 systematic review of 43 studies defines body checking as “the repeated evaluation of one’s own body,” and lists exactly those behaviors (Hofschröer 2025).
Used occasionally, they’re measurement. Used often, they’re a known driver of body dissatisfaction.
That doesn’t make progress photos forbidden. It makes frequency the thing you have to get right.
The dose is the whole variable
The clearest evidence comes from a randomized crossover study of 179 women (103 at high risk for eating disorders, 76 at low risk). After a baseline measuring each woman’s habitual checking frequency, participants completed two randomized three-day conditions — checking at their normal frequency, versus tripling it (Geiger 2024).
The results split cleanly.
- At habitual frequency, there was no harm — positive affect actually increased.
- At tripled frequency, high-risk women showed significantly worse drive for thinness, body dissatisfaction and negative affect (all p < .001).
- Low-risk women were largely unaffected, though drive for thinness still rose in the tripled condition.
An article that tells you to start looking at your body more often is prescribing the exact manipulation that caused measurable harm. So this one won’t.
One correction while I’m here, because it’s the easiest citation error in this subject. That 2025 systematic review confirmed people tend to check because they already feel bad — negative affect as the antecedent — but on whether checking then makes it worse, its own words were that “findings regarding its short- and long-term role in maintaining negative affect were inconsistent.” It is not proof that checking harms you. The clearer signal is the frequency finding above.
The rules I’d actually give
- Progress photos no more often than once every 4–6 weeks. Not weekly. Not daily.
- Waist once a month; if you weigh daily, read the seven-day average, not this morning’s number.
- Never check right after eating. Body checking after food intake measurably increases eating-related threat perception (Spix 2026).
- Checking more often than you planned is a signal to stop, not to look harder.
And be honest about what a photo is worth. Lighting, posture, time of day, hydration, camera angle and lens change how a body looks far more than 4–6 weeks of real change does. A photo is not a measurement. If you want a number, the tape measure is the number.
If you use a mirror at all, aim it at function rather than appearance — how your clothes fit, how you move, what your energy is like. That’s the only mirror framing with supporting evidence behind it (Costello 2026).
When to talk to someone
Reach out to a physician, a registered dietitian, or a licensed mental-health professional if:
- You check, weigh, measure, pinch or photograph more often than you intended, or can’t stop once you start.
- Checking reliably makes you feel worse, and you do it anyway.
- Concern about weight, food or appearance has become “obsessive or fixated” — NIMH’s wording.
- The number on a scale or tape sets your mood for the day, or you feel guilt or shame after weighing.
- You are restricting food, purging, using laxatives, or exercising to compensate for eating.
- You are avoiding mirrors, photos or social situations because of how you think you look.
- You find yourself chasing a lower body-fat percentage, or checking more, because of this article.
This is not only a women’s issue — body checking is similarly elevated in muscle dysmorphia and anorexia nervosa among boys and men (Ganson 2025). And eating disorders are treatable; early detection improves outcomes (NIMH).
Verified US support resources
| Resource | Contact | Hours |
|---|---|---|
| National Alliance for Eating Disorders Helpline | 1-866-662-1235 | Mon–Fri, 9:00 am – 7:00 pm ET. Licensed therapists specializing in eating disorders. Not a 24/7 crisis line. |
| ANAD Helpline | 1-888-375-7767 | Mon–Fri, 9:00 am – 9:00 pm CT. Messages outside hours are returned. |
| Crisis Text Line | Text HOME to 741741 | Free, 24/7. |
| 988 Suicide & Crisis Lifeline | Call or text 988, or chat at 988lifeline.org | 24/7. |
| Life-threatening emergency | 911 | Any time. |
Why you should keep weighing yourself
The popular version of this article ends by telling you to get rid of your scale. The evidence doesn’t support that.
National Weight Control Registry members “have lost an average of 33 kg [73 lb] and maintained the loss for more than 5 y” — and self-monitoring weight is among the registry’s most commonly reported strategies, alongside high physical activity and consistent eating patterns across weekdays and weekends (Wing & Phelan 2005).
More directly: in a 2025 randomized trial, app-based daily self-weighing produced −1.85 kg (−4.1 lb) at six months, with 2.11 times the odds of losing ≥5% of body weight. And the finding that resolves the tension — the proportion of participants scoring above threshold for disordered-eating symptoms declined in the intervention relative to control (adjusted OR 0.51, p = 0.024) (Doody 2025).
Two limits there, because they matter: it was an app intervention bundled with action plans and weekly review, not daily weighing on its own, and it was run in adults with obesity, so it doesn’t automatically generalize.
So what is the real problem, if not the scale? The reaction to it. On days the scale showed a gain, participants reported more negative mood, more guilt and shame, and lower confidence — and greater guilt/shame and lower motivation after the weigh-in predicted less effective weight-control behavior (Hagerman 2024).
The enemy was never the measurement. It’s treating one morning’s reading as a verdict.
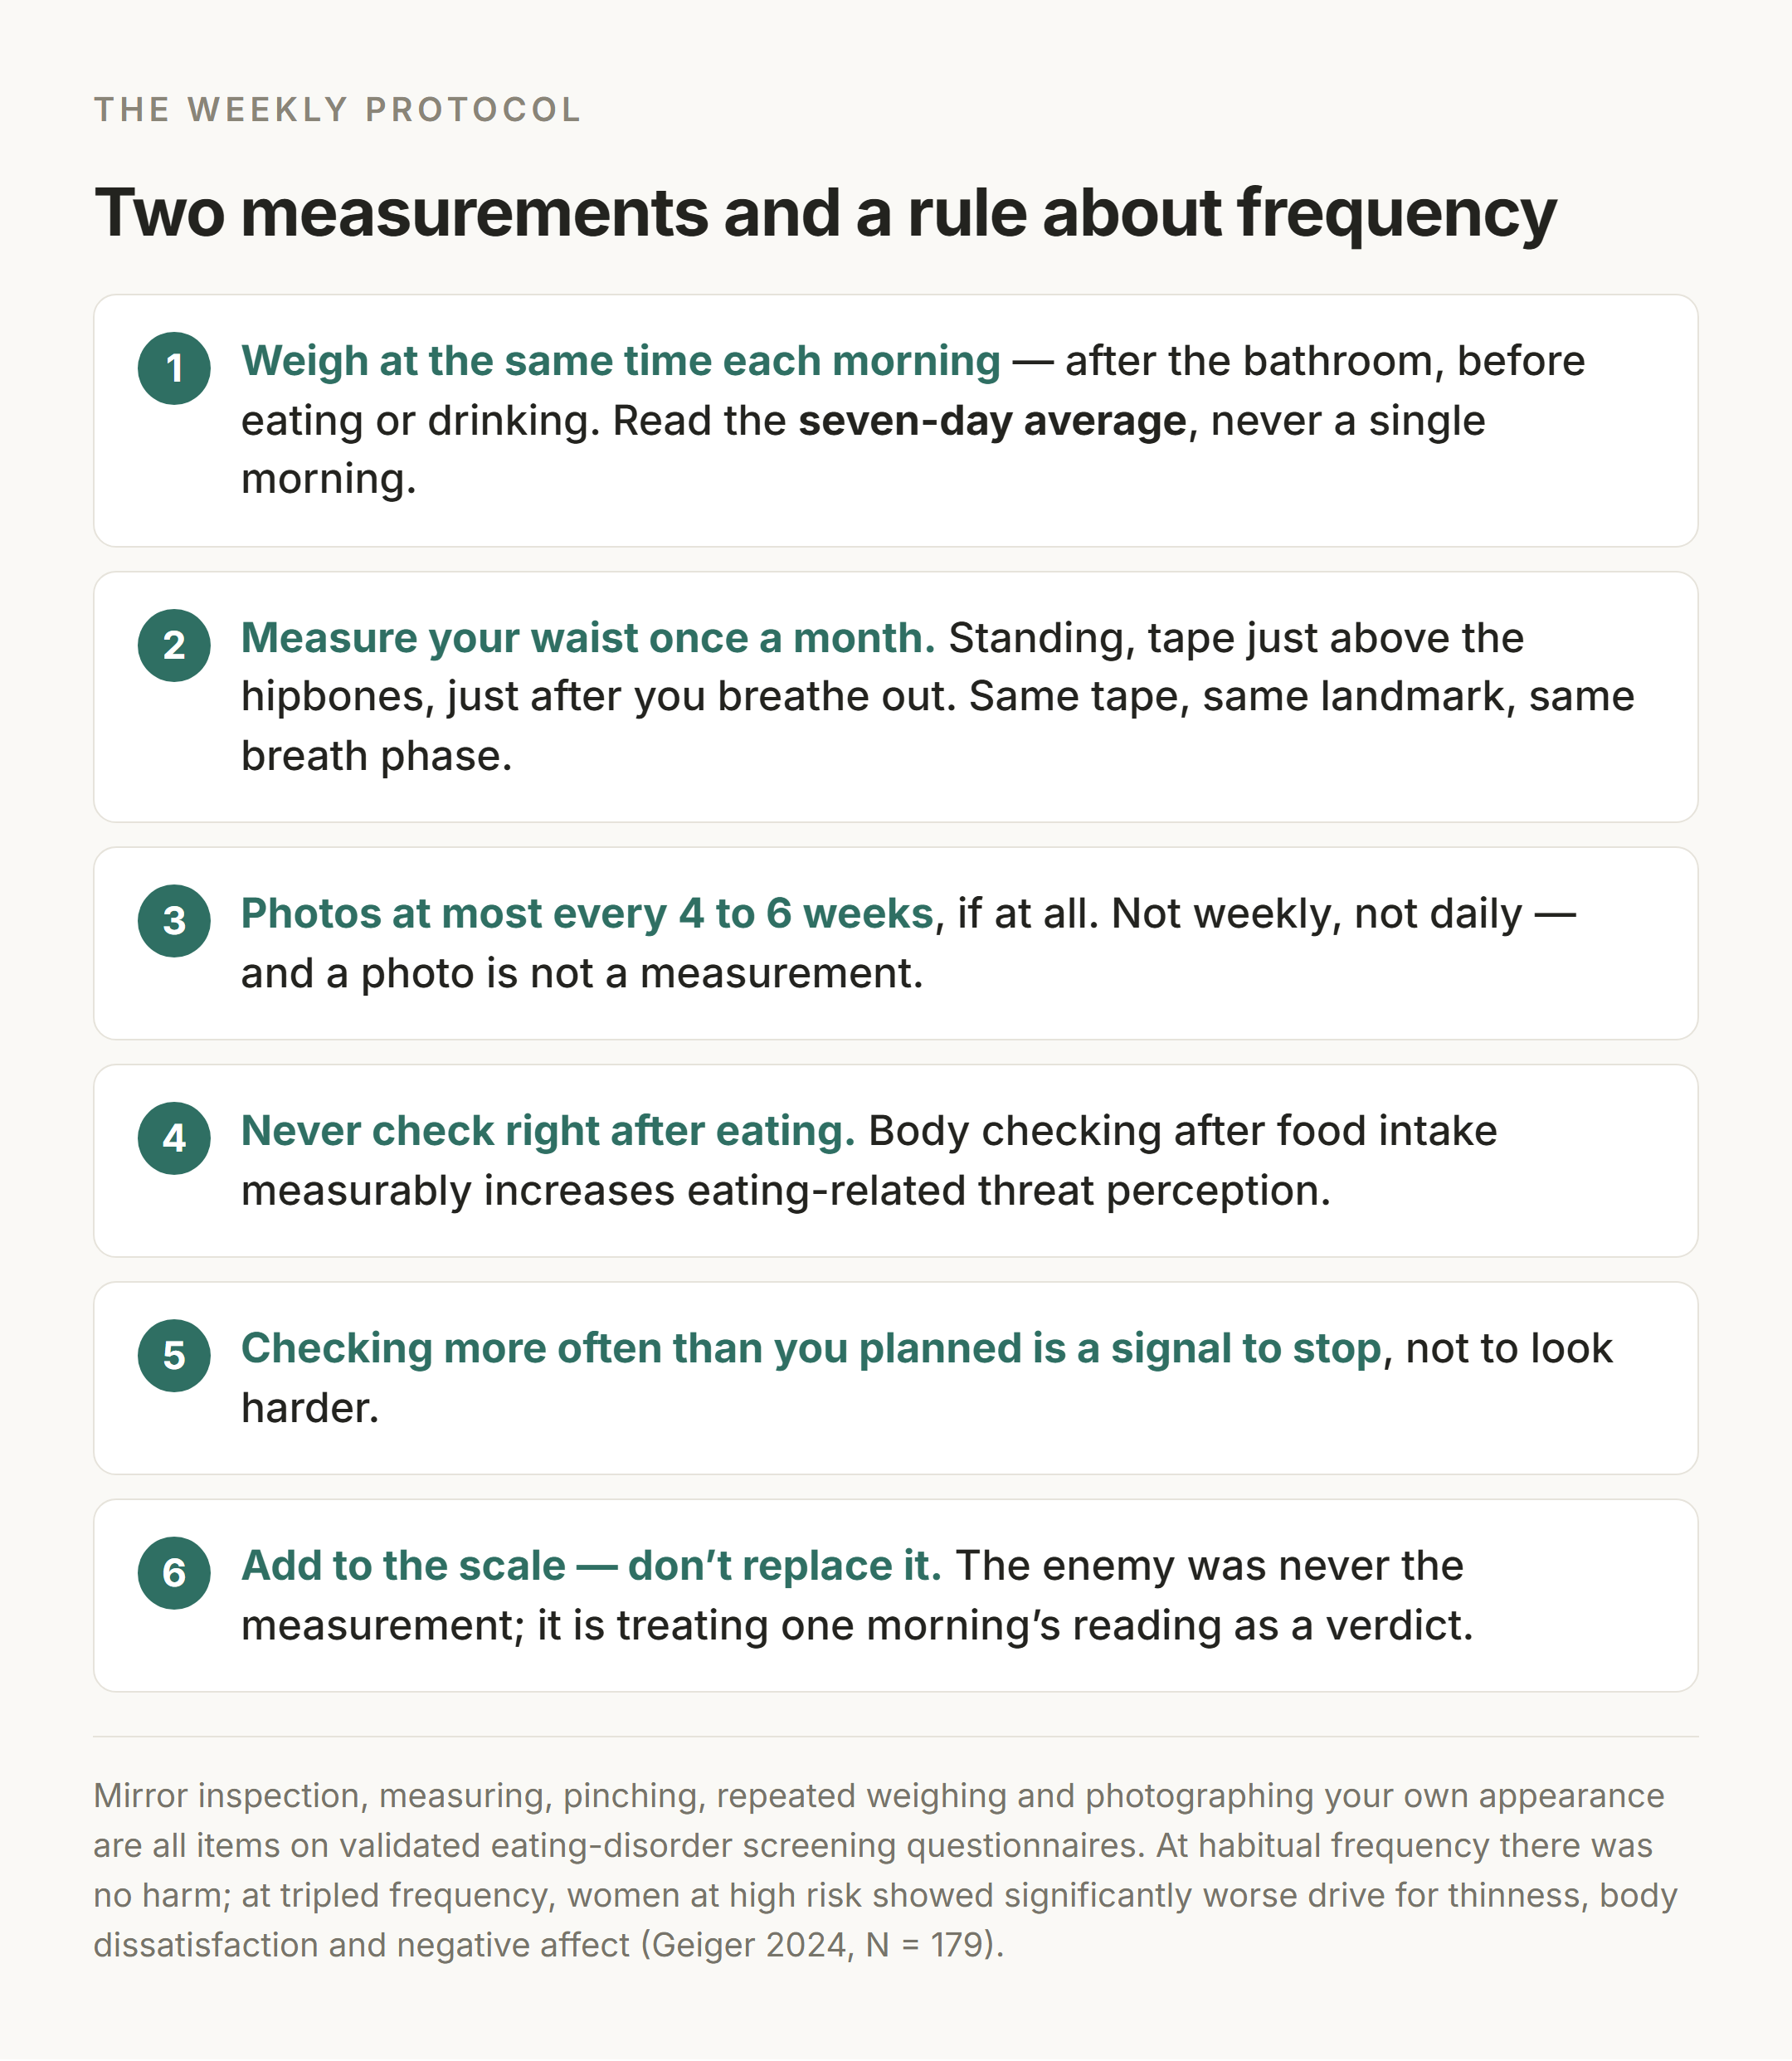
The protocol, in four lines
Add to the scale. Don’t replace it.
- Weigh at the same time each morning, after the bathroom, before eating or drinking. Read the seven-day average, never the daily number.
- Measure your waist once a month: standing, tape just above the hipbones, just after breathing out. Keep it under half your height.
- Photos at most every 4–6 weeks, if at all — and never right after eating.
- Checking more than you planned means stop.
Two measurements and a rule about frequency.

Photo: Sarah Chai / Pexels
If it was one big meal that sent the number up overnight, what the scale is really showing after you overeat takes that same day-to-day swing apart in more detail.
I still weigh myself most mornings. What changed is that I stopped reading the number as a report card and started reading the line it draws over a week.
The 2.4 pounds from last month came back off within three days, without my doing anything about it. The scale hadn’t lied to me. I had just been asking it a question it was never built to answer.
A tape measure and a little patience turned out to be the better instruments. Slower, quieter, and telling you something that’s actually there.
Important notes
- This article is general educational information, not medical advice. It does not diagnose or treat any condition, and individual figures vary considerably.
- Consult a licensed clinician before changing your diet, exercise, or weight-management approach.
- See a clinician if your waist exceeds 40 inches (102 cm) as a man or 35 inches (89 cm) as a woman, or your waist-to-height ratio is 0.5 or above — including if your BMI is normal, since roughly 1 in 4 normal-BMI adults in one general-population study met that threshold. Also if you are losing weight without trying, or faster than about 1–2 lb per week over a sustained period.
- Adult thresholds do not apply if you are under 18. If you are pregnant or postpartum, waist and weight interpretation differs entirely — ask your obstetric provider rather than self-interpreting.
- If you have diabetes, hypertension, dyslipidemia, fatty liver, or a family history of cardiometabolic disease, waist-based measures carry independent prognostic weight — discuss them with your clinician.
- A consumer device reading is not a diagnosis. Clinical assessment requires validated methods with appropriate cut-offs.
- Eating disorders affect men and boys as well as women and girls, and they are treatable. Early detection improves outcomes.
- Urgent: thoughts of self-harm or suicide → call or text 988, or call 911. Fainting, chest pain, palpitations, or severe weakness during weight loss or food restriction → seek emergency care.
References
- Bhutani S, Kahn E, Tasali E, Schoeller DA — “Composition of two-week change in body weight under unrestricted free-living conditions,” Physiological Reports. 2017;5(13):e13336 (n = 46)
- Kreitzman SN, Coxon AY, Szaz KF — “Glycogen storage: illusions of easy weight loss, excessive weight regain, and distortions in estimates of body composition,” Am J Clin Nutr. 1992;56(1 Suppl):292S–293S
- Orsama AL, Mattila E, Ermes M, van Gils M, Wansink B, Korhonen I — “Weight rhythms: weight increases during weekends and decreases during weekdays,” Obesity Facts. 2014;7(1):36–47 (n = 80, 4,657 measurements)
- NIST — X-Ray Mass Attenuation Coefficients, Table 2 (tissue densities per ICRU Report 44, 1989)
- NHLBI (NIH) — Assessing Your Weight and Health Risk
- Alberti KG, Eckel RH, Grundy SM, et al. — “Harmonizing the metabolic syndrome,” Circulation. 2009;120(16):1640–1645
- Siddiquee AT et al. — Bangladesh-specific waist circumference cutoffs, BMJ Open. 2025
- Lubogo D et al. — Derived waist cutoff in Ugandan women, PLOS Global Public Health. 2025
- Park S et al. — Waist-to-height ratio and cardiovascular outcomes in type 2 diabetes, Diabetes Obes Metab. 2026
- Valeva S et al. — General and central obesity in Central-Southern Bulgaria, Healthcare. 2026
- Rubino F, Cummings DE, Eckel RH, et al. — “Definition and diagnostic criteria of clinical obesity” (Lancet Commission on Clinical Obesity), Lancet Diabetes & Endocrinology. 2025;13(3):221–262
- Graybeal AJ et al. — “Assessing the reliability and cross-sectional and longitudinal validity of fifteen bioelectrical impedance analysis devices,” British Journal of Nutrition. 2023
- Tinsley GM, Morales E, Forsse JS, Grandjean PW — “Impact of acute dietary manipulations on DXA and BIA body composition estimates,” Med Sci Sports Exerc. 2017
- Tinsley GM, Stratton MT, Harty PS, et al. — “Influence of acute water ingestion and prolonged standing on raw bioimpedance,” J Electr Bioimpedance. 2022
- Ferri-Morales A et al. — “Influence of bladder filling on body composition by bioimpedance analysis,” Sensors. 2024
- Reas DL, Whisenhunt BL, Netemeyer R, Williamson DA — “Development of the Body Checking Questionnaire,” Int J Eat Disord. 2002
- Hofschröer V, Vivell M-B, Vocks S, Hartmann AS — “Short-term functions and long-term consequences of body checking as a transdiagnostic phenomenon: a systematic review,” Journal of Eating Disorders. 2025;13:281 (43 studies) — cited here for definition and scope only
- Geiger G, Opladen V, Vivell M-B, Vocks S, Hartmann AS — “Longer-term consequences of increased body checking in women at risk for eating disorders,” PLoS One. 2024;19(12):e0316190 (N = 179)
- Spix M, Martijn C, Jansen A — “Don’t check after a snack: body checking increases eating-related threat perception,” Appetite. 2026
- Ganson KT, Testa A, Rodgers RF, Murray SB, Nagata JM — “Body checking behaviors among boys and men,” Int J Eat Disord. 2025
- Costello K, Javaras KN, Brooks JM, Anderson DA, Walker DC — “In the mirror: Functional appreciated bodies (IM FAB),” Body Image. 2026
- Wing RR, Phelan S — “Long-term weight loss maintenance” (National Weight Control Registry), Am J Clin Nutr. 2005;82(1 Suppl):222S–225S
- Doody P et al. — App-based daily self-weighing, BMC Medicine. 2025
- Hagerman CJ et al. — “Daily mood and self-weighing,” Journal of Behavioral Medicine. 2024
- NIMH (NIH) — Eating Disorders
- National Alliance for Eating Disorders — helpline verified 2026-08-14; ANAD — helpline verified 2026-08-14